
Creating Basic Reports
Purpose:
You need to create a Basic Report in PDQ Inventory.
Resolution:
This article covers everything you need to know about creating and running Basic Reports in PDQ Inventory.
Contents:
Saving a Basic Report to a File
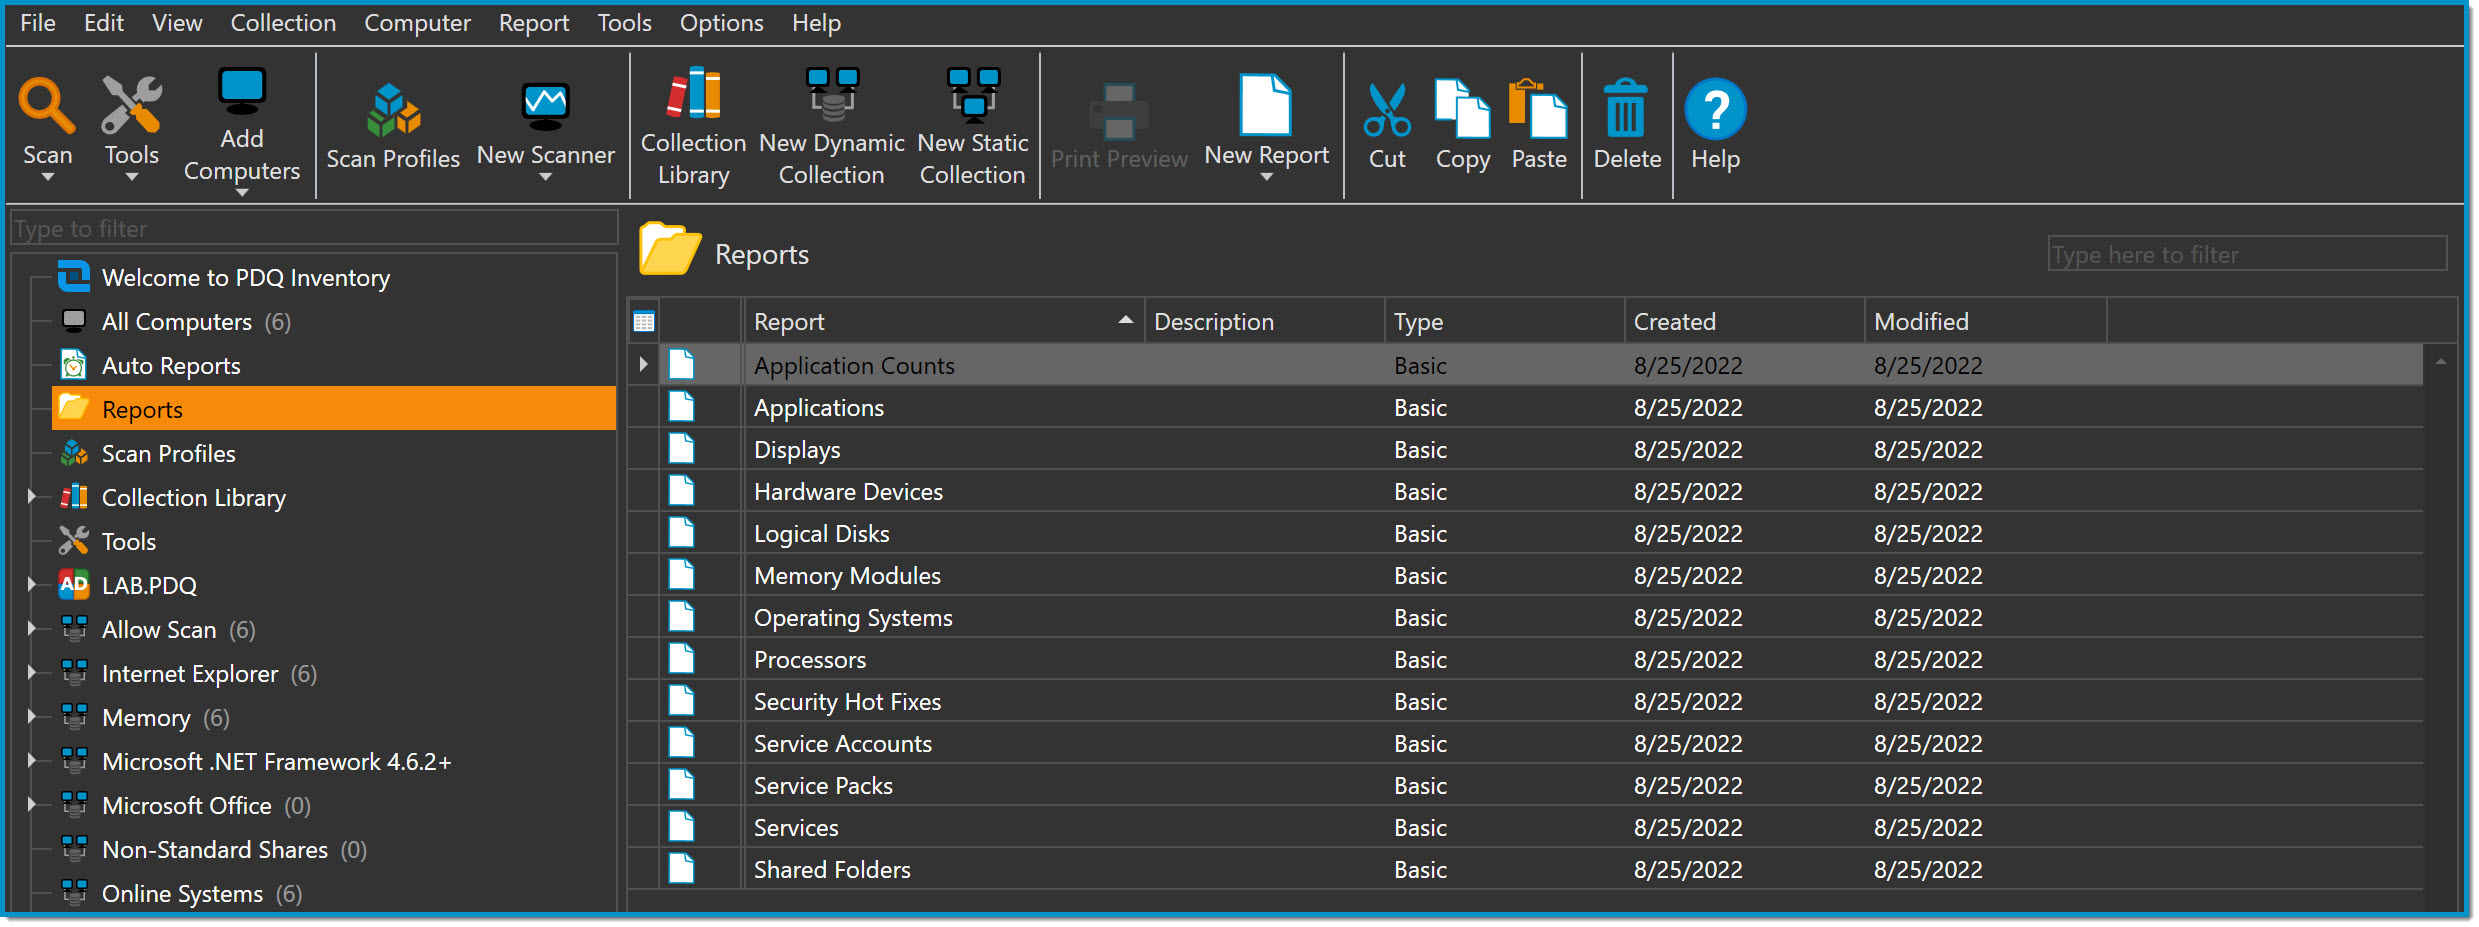
Report Folders
The Report Folder can be found in the tree. New Basic Reports & SQL Reports will save here by default, unless you create a new Report while in a different Report Folder.
New Report Folders can be created as child folders by right clicking the Reports Folder and selecting New > Report Folder in the context menu or by selecting Report > New Report Folder in the menu with a Report Folder selected in the tree.
New Report Folders can also be created independent of the default Report Folder by right clicking an empty space in the tree and selecting New > Report Folder in the context menu or by selecting Report > New Report Folder in the menu with nothing selected in the tree.
Note: Deleting a Report Folder will also delete the Reports inside of that folder. This action cannot be undone.
New Basic Report
A new Basic Report can be created by selecting New Report > Basic Report in the toolbar or by selecting Report > New Report > Basic Report in the menu.
You can also right click any Report Folder and select New > Basic Report in the context menu to have the new Basic Report save in the desired folder instead of the default Report Folder.
New Basic Reports can also be created from a Dynamic Collection by right clicking the collection and selecting New > Report From Collection in the context menu or by selecting Report > New Report > Report From Collection in the menu. This will create a new Basic Report using the same filters as the Dynamic Collection the Report was made from.
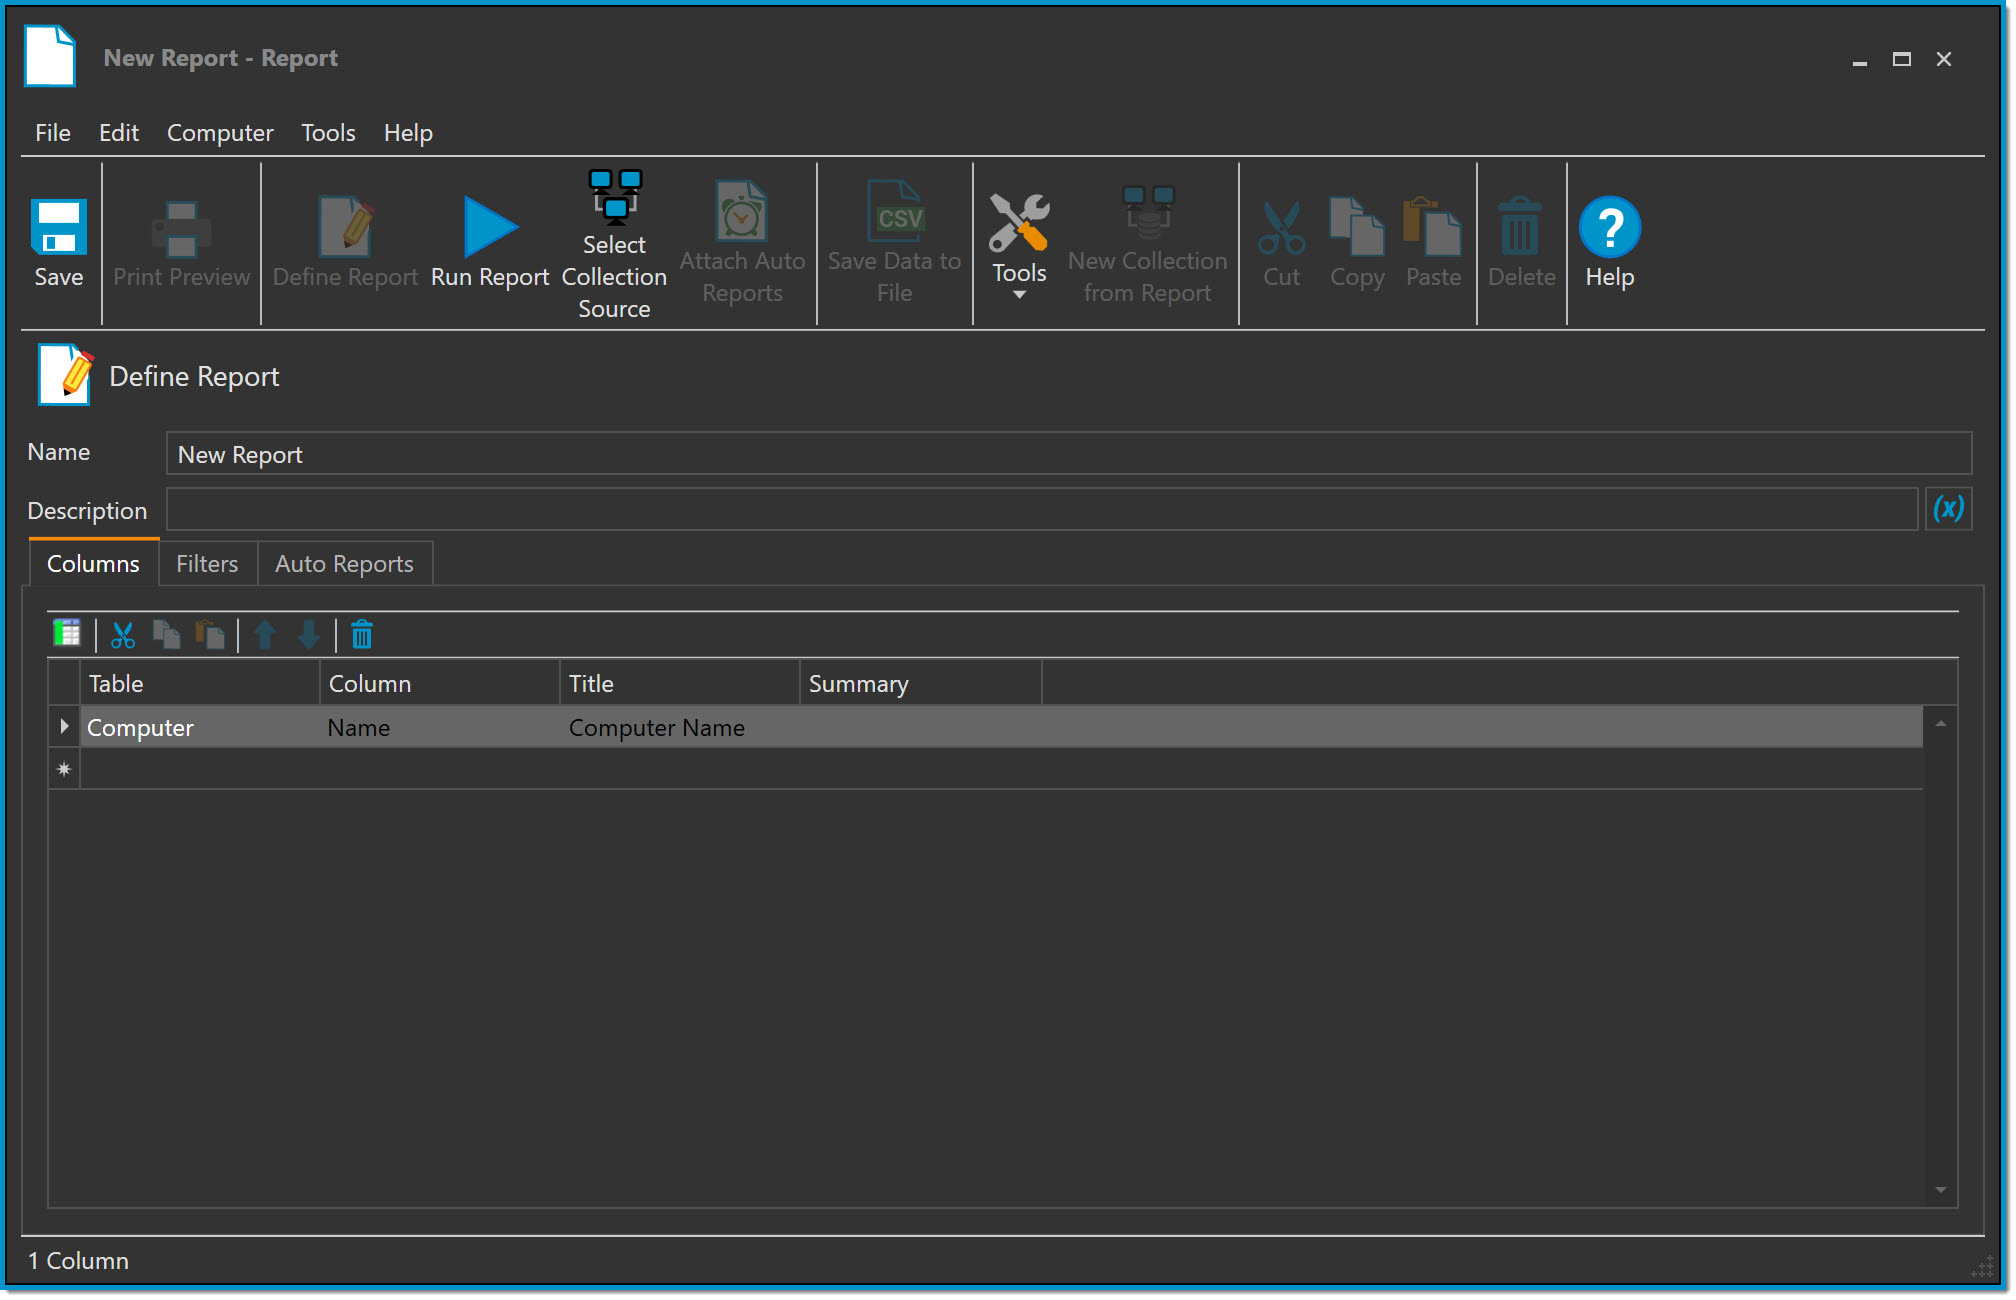
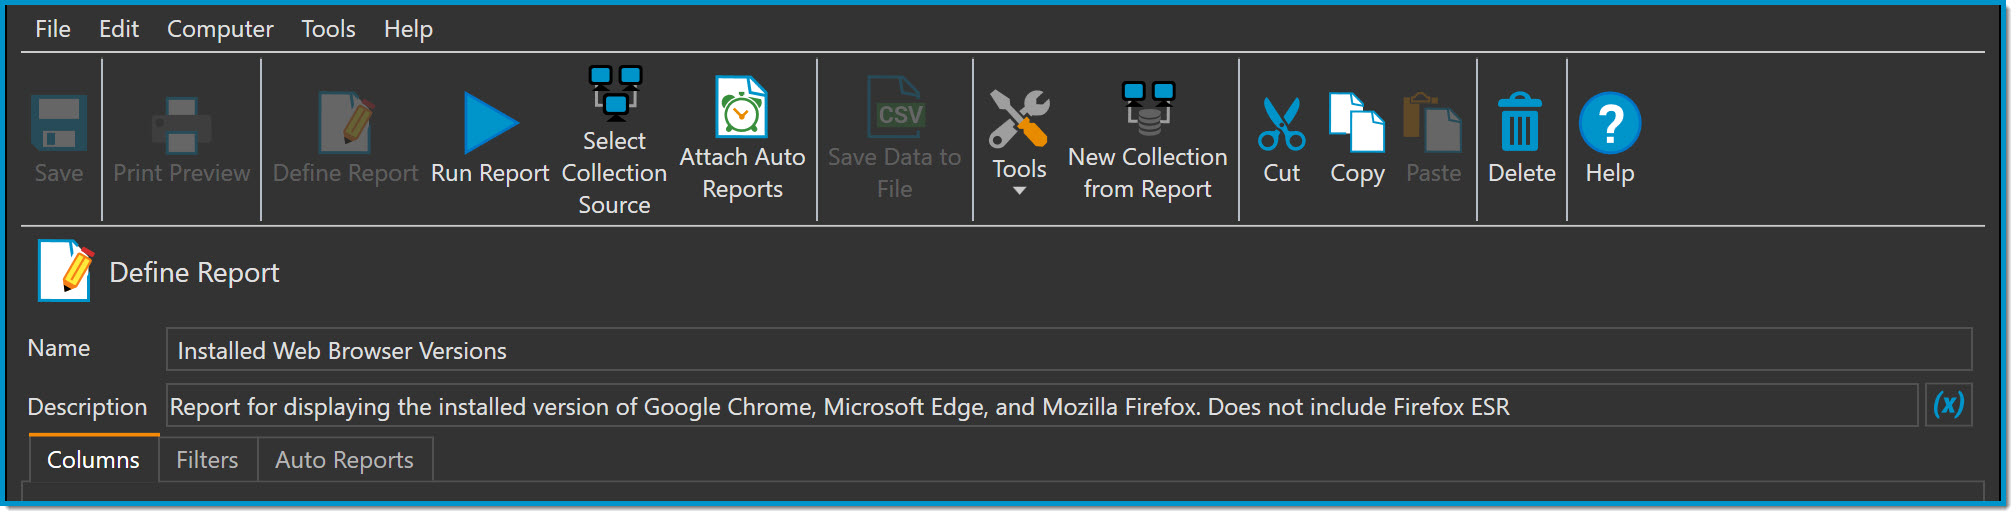
Name the Report using the Name field, and the optional Description field, before saving. This will make identifying the new Basic Report easier in the Report Folder.
Note: If you do not name your Report, it will default to the name "New Report" and will not increment the name if multiple reports are saved unnamed. This could potentially cause multiple Reports in a single Report Folder with the same name, making it difficult to distinguish between Reports.
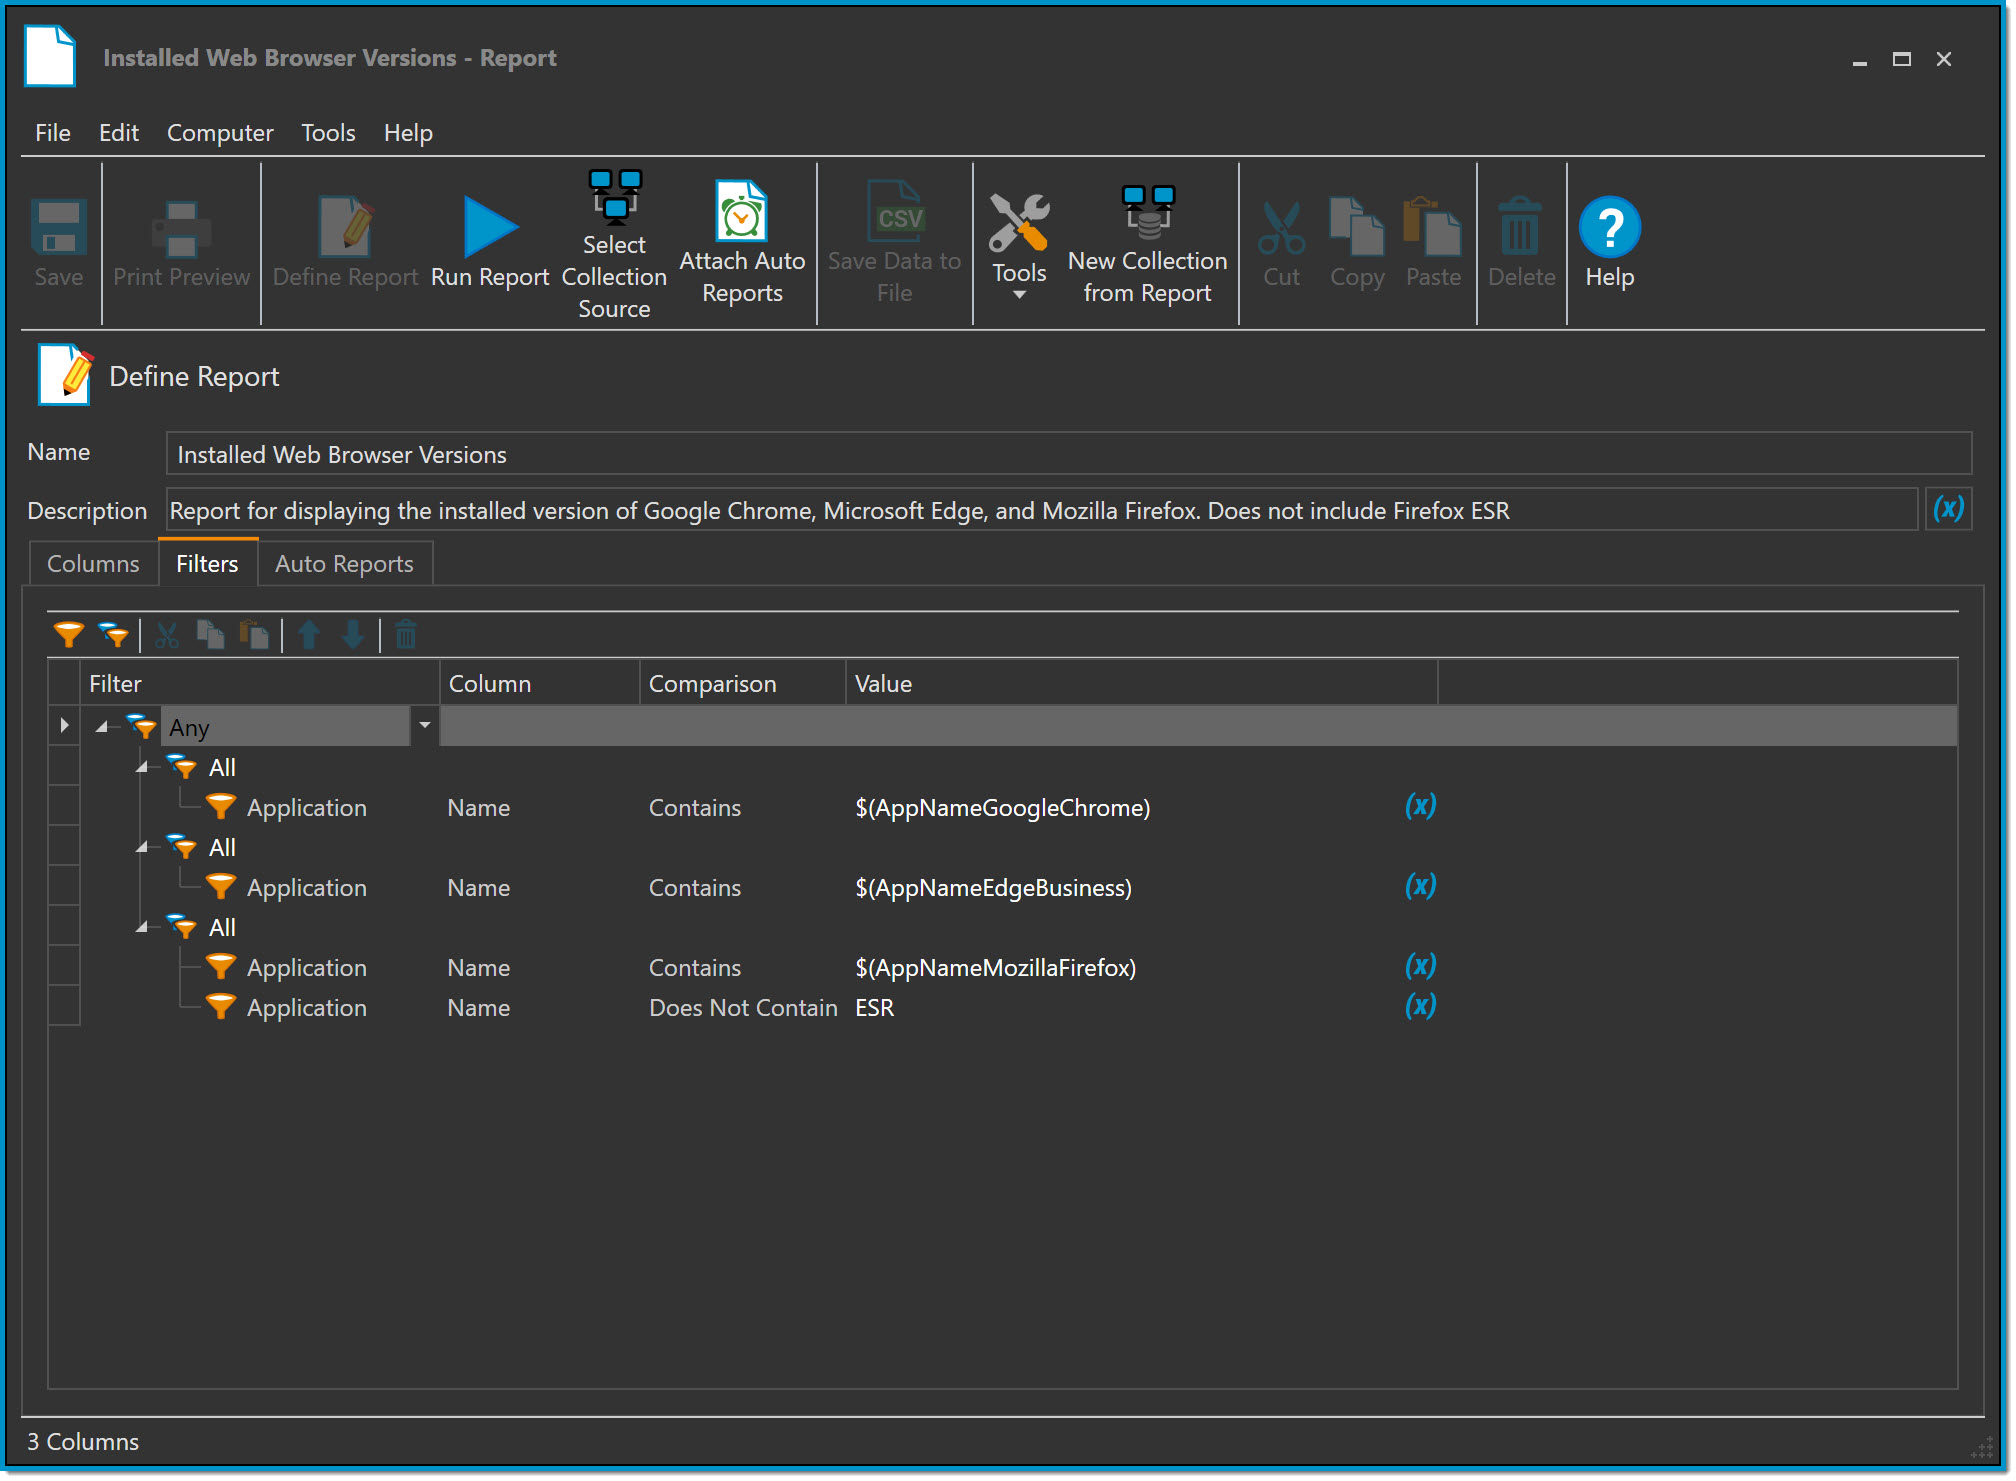
Defining a Basic Report
There are three Tabs available to define a Basic Report. The Columns tab, the Filters tab, and the Auto Reports tab. The toolbar also contains some additional options for the Report that remain available regardless of the active tab of the Report.
The options available in the toolbar are:
- Define Report - This is where a new Basic Report opens by default, and where you can find the Columns, Filters, and Auto Reports tabs.
- Run Report - Runs the Report and displays the data in the Report window.
- Select Collection Source - (Optional) Select which computer collections to run the Report against. This will default to All Computers, unless specified.
- Attach Auto Reports - (Optional) Select one or more Auto Reports to attach the Basic Report to.
- Save Data to File - Save the output of the Report as a specified file type.
- Tools - Opens the PDQ Inventory Tools menu, pre-populated with the computers in the Report.
- New Collection From Report - Creates a New Dynamic Collection using the filters configured in the Report's Filters tab.
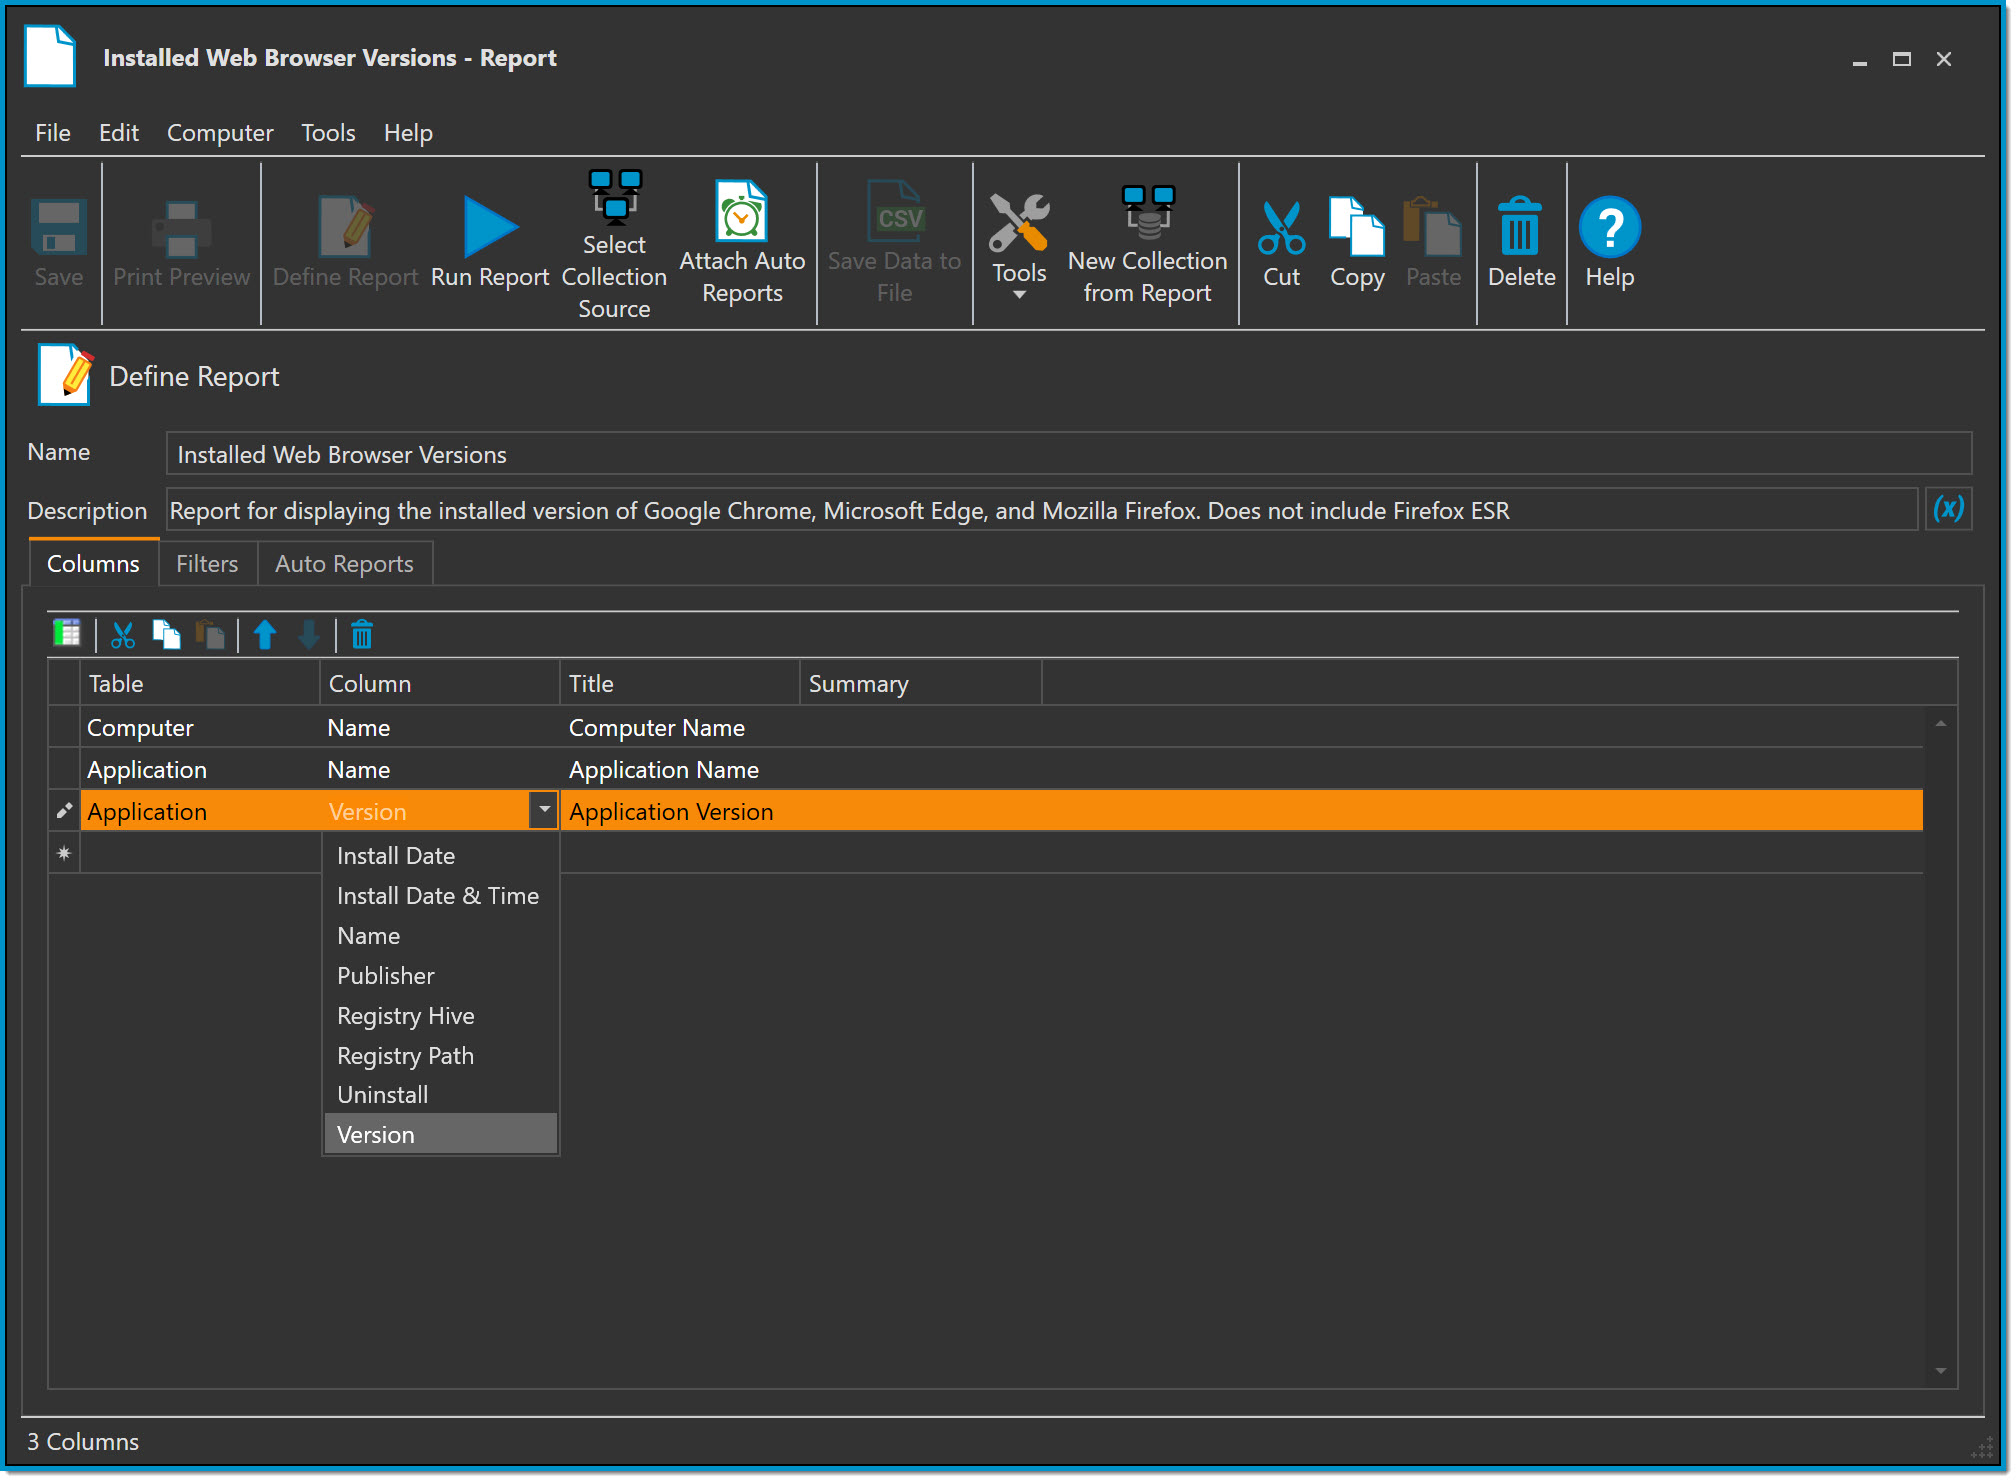
Columns Tab
The Columns tab is where you select the data to be displayed in the output of the Report. In a Basic Report, some database tables are unable to be displayed together. After selecting an option in the Table column, incompatible tables will be grayed out when selecting additional tables.
The Columns tab has the following options:
- Table - This is where you select the PDQ Inventory database table to pull the Report data from
- Column - This is where you select the column to be displayed from the selected database table
- Title - (Optional) Allows you to configure a custom name for the column in the Report output.
- If you don't rename the column, it will appear in the Report as it appears in the PDQ Inventory database.
- Summary - (Optional) Each column can be displayed as a summary, which results in a single value that summarizes the data relative to the other non-summary columns in the report. Not all summaries are available for all data types.
- The Summary options are:
- Count - (All Columns) A count of the unique Values within the column
- First - (Text, Date/Time) The first item alphabetically (text) or chronologically (date/time)
- Last - (Text, Date/Time) The last item alphabetically (text) or chronologically (date/time)
- Minimum - (Number) The smallest Value
- Maximum - (Number) The largest Value
- Sum - (Number) All Values in the column added up
- Average - (Number) The average of all of the Values in the column
- The Summary options are:
Filters Tab
The Filters for a Basic Report in PDQ Inventory function exactly the same as the Filters for a Dynamic Collection. When creating a Basic Report from a Dynamic Collection, the filters will be pre-populated with the same filters as the Dynamic Collection.
For an in-depth look into how filtering works in PDQ Inventory, refer to our PDQ Inventory Filtering & Advanced Filtering Knowledge Base articles.
PDQ Inventory Filters: Usage & Examples
PDQ Inventory Filters: Advanced Usage & Examples
Note: Leaving the Filters tab blank will output the unfiltered data from each column in the Columns tab for every computer in the collection the report was ran against.
Auto Reports Tab
The Auto Reports tab allows you to manage the Auto Report(s) a Basic Report is attached to.

The Attach Button will display a dropdown list of available Auto Reports to attach the Basic Report to, along with a New Auto Report option.
The Detach Button will detach the Basic Report from the highlighted Auto Report.
Running a Basic Report
Once the Columns and Filters have been defined, a Basic Report must be ran before the report data can be displayed. There are several ways to Run a Basic Report.
- If the Report is currently opened, select Run Report from the toolbar.
- From a Report Folder: right click a Report and select Open and Run Report, or use the shortcut Ctrl+F5 to open and run the highlighted Report.
- In the menu, select Report > Run Report and choose a Report from the list.
- To quickly run a Report against All computers: right click All Computers or any empty space in the PDQ Inventory tree, select Run Report in the context menu, and choose a Report from the dropdown.
- To quickly run a Report against a collection: right click any collection, select Run Report in the context menu, and choose a Report from the dropdown.
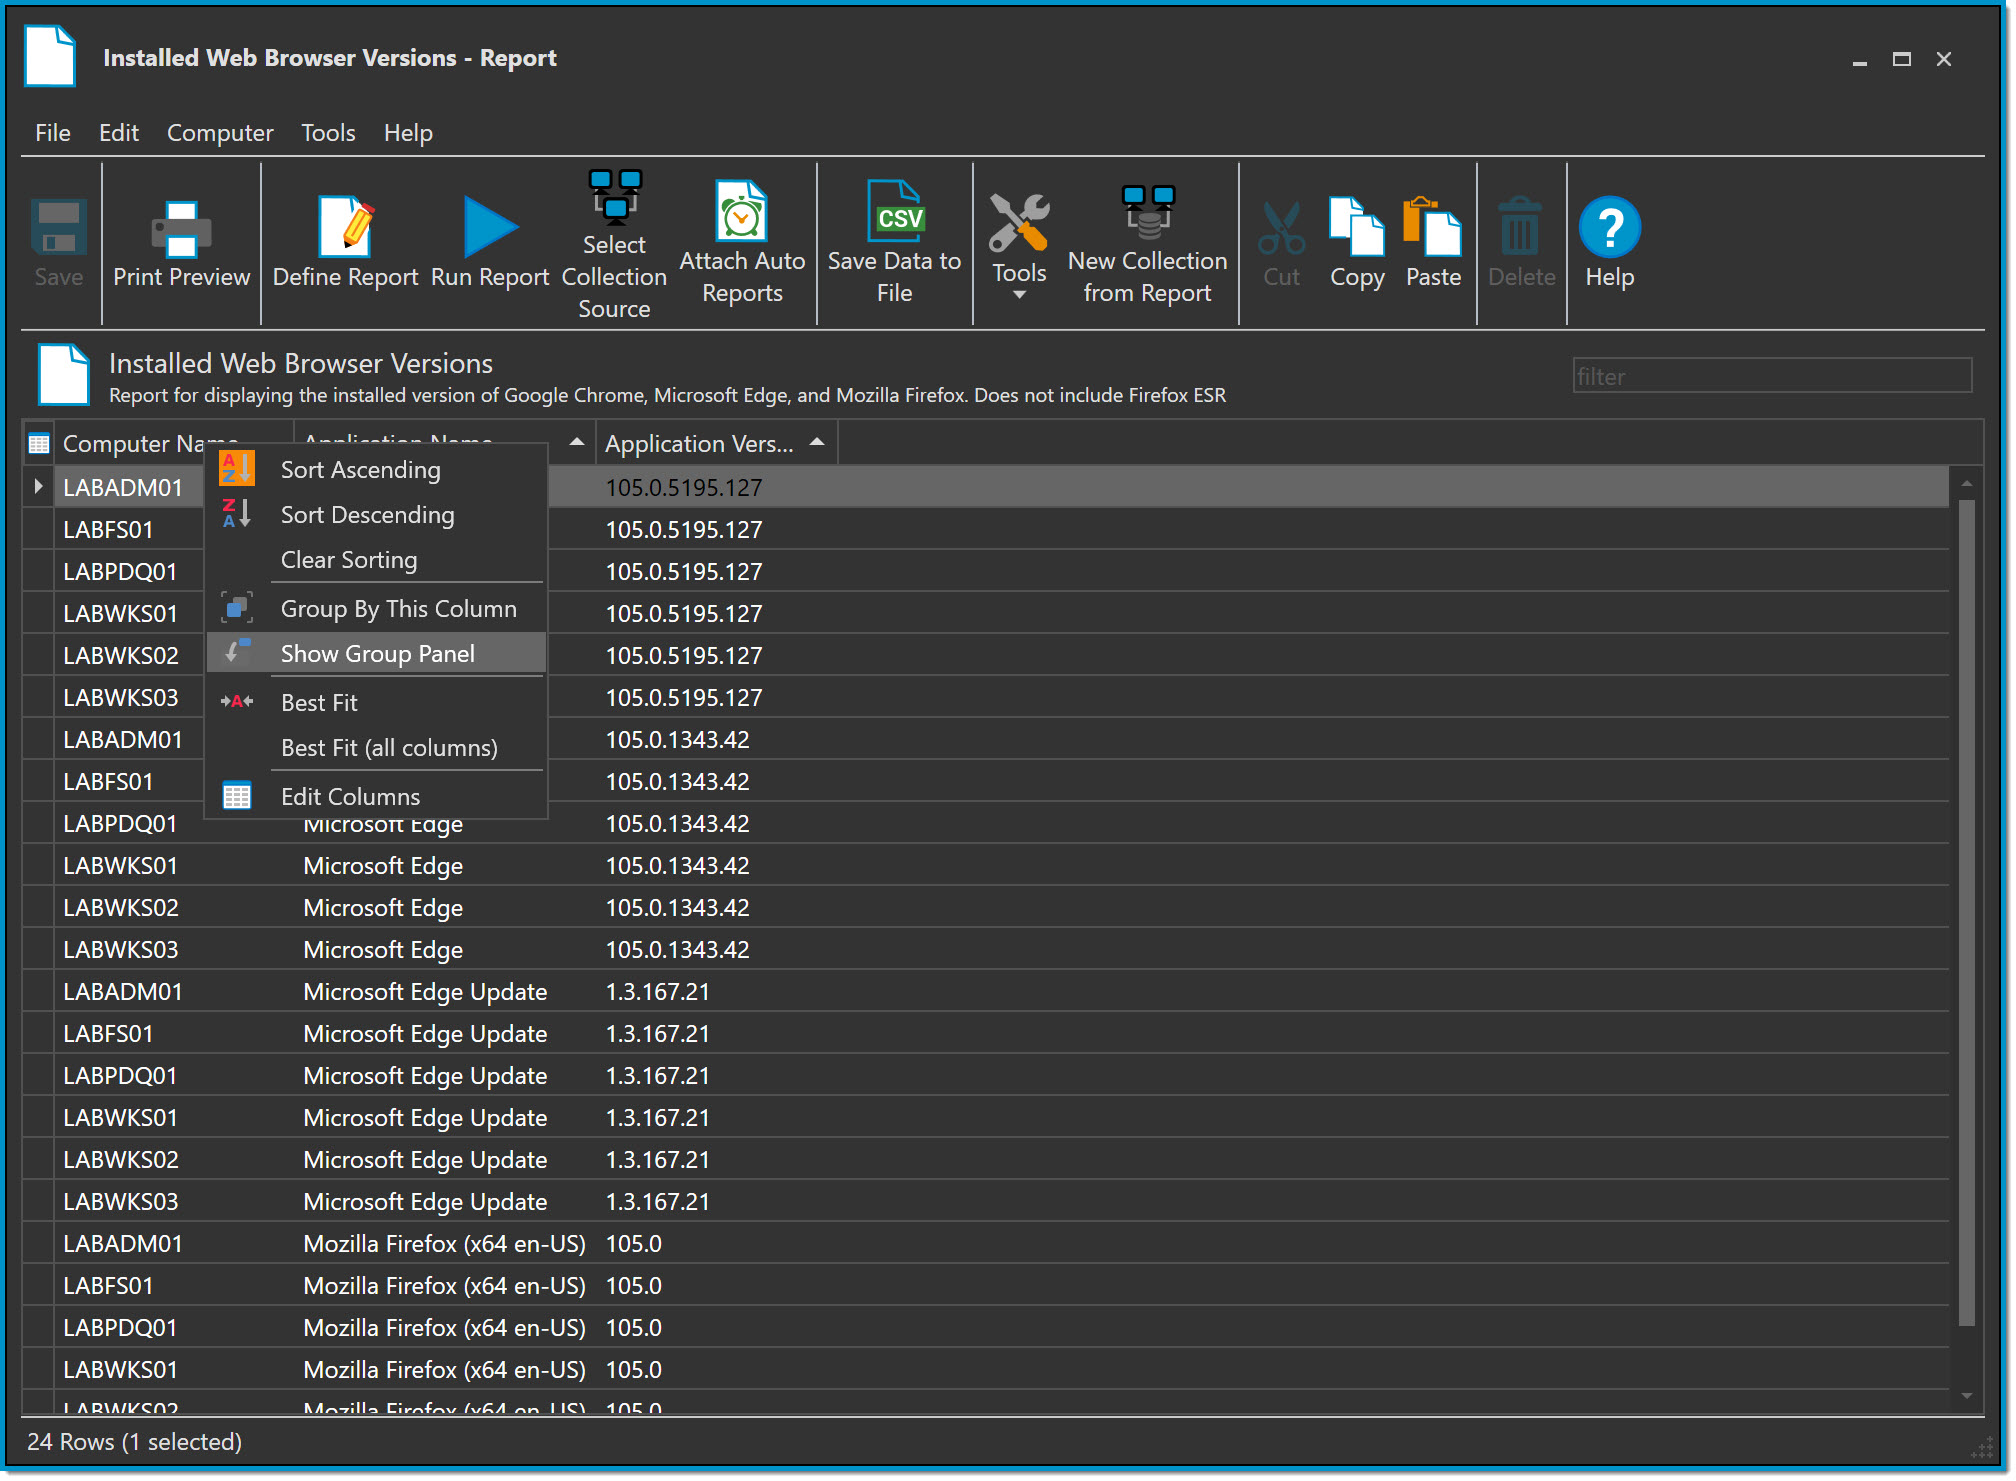
Grouping Report Columns
After running a Basic Report, the defined columns will be displayed and the rows of the Report will be populated with the filtered data. To make viewing and navigating the contents of the Report easier, PDQ Inventory allows you to group the columns of a Report. The data displayed in a group will remain in the order of the columns of the Report.
The Group Panel allows you to drag & drop columns to group the column. Multiple columns can be dragged into the Group Panel to create sub-groupings. To display the Group Panel, and enable drag & drop column grouping, right click any column and select Show Group Panel in the context menu.
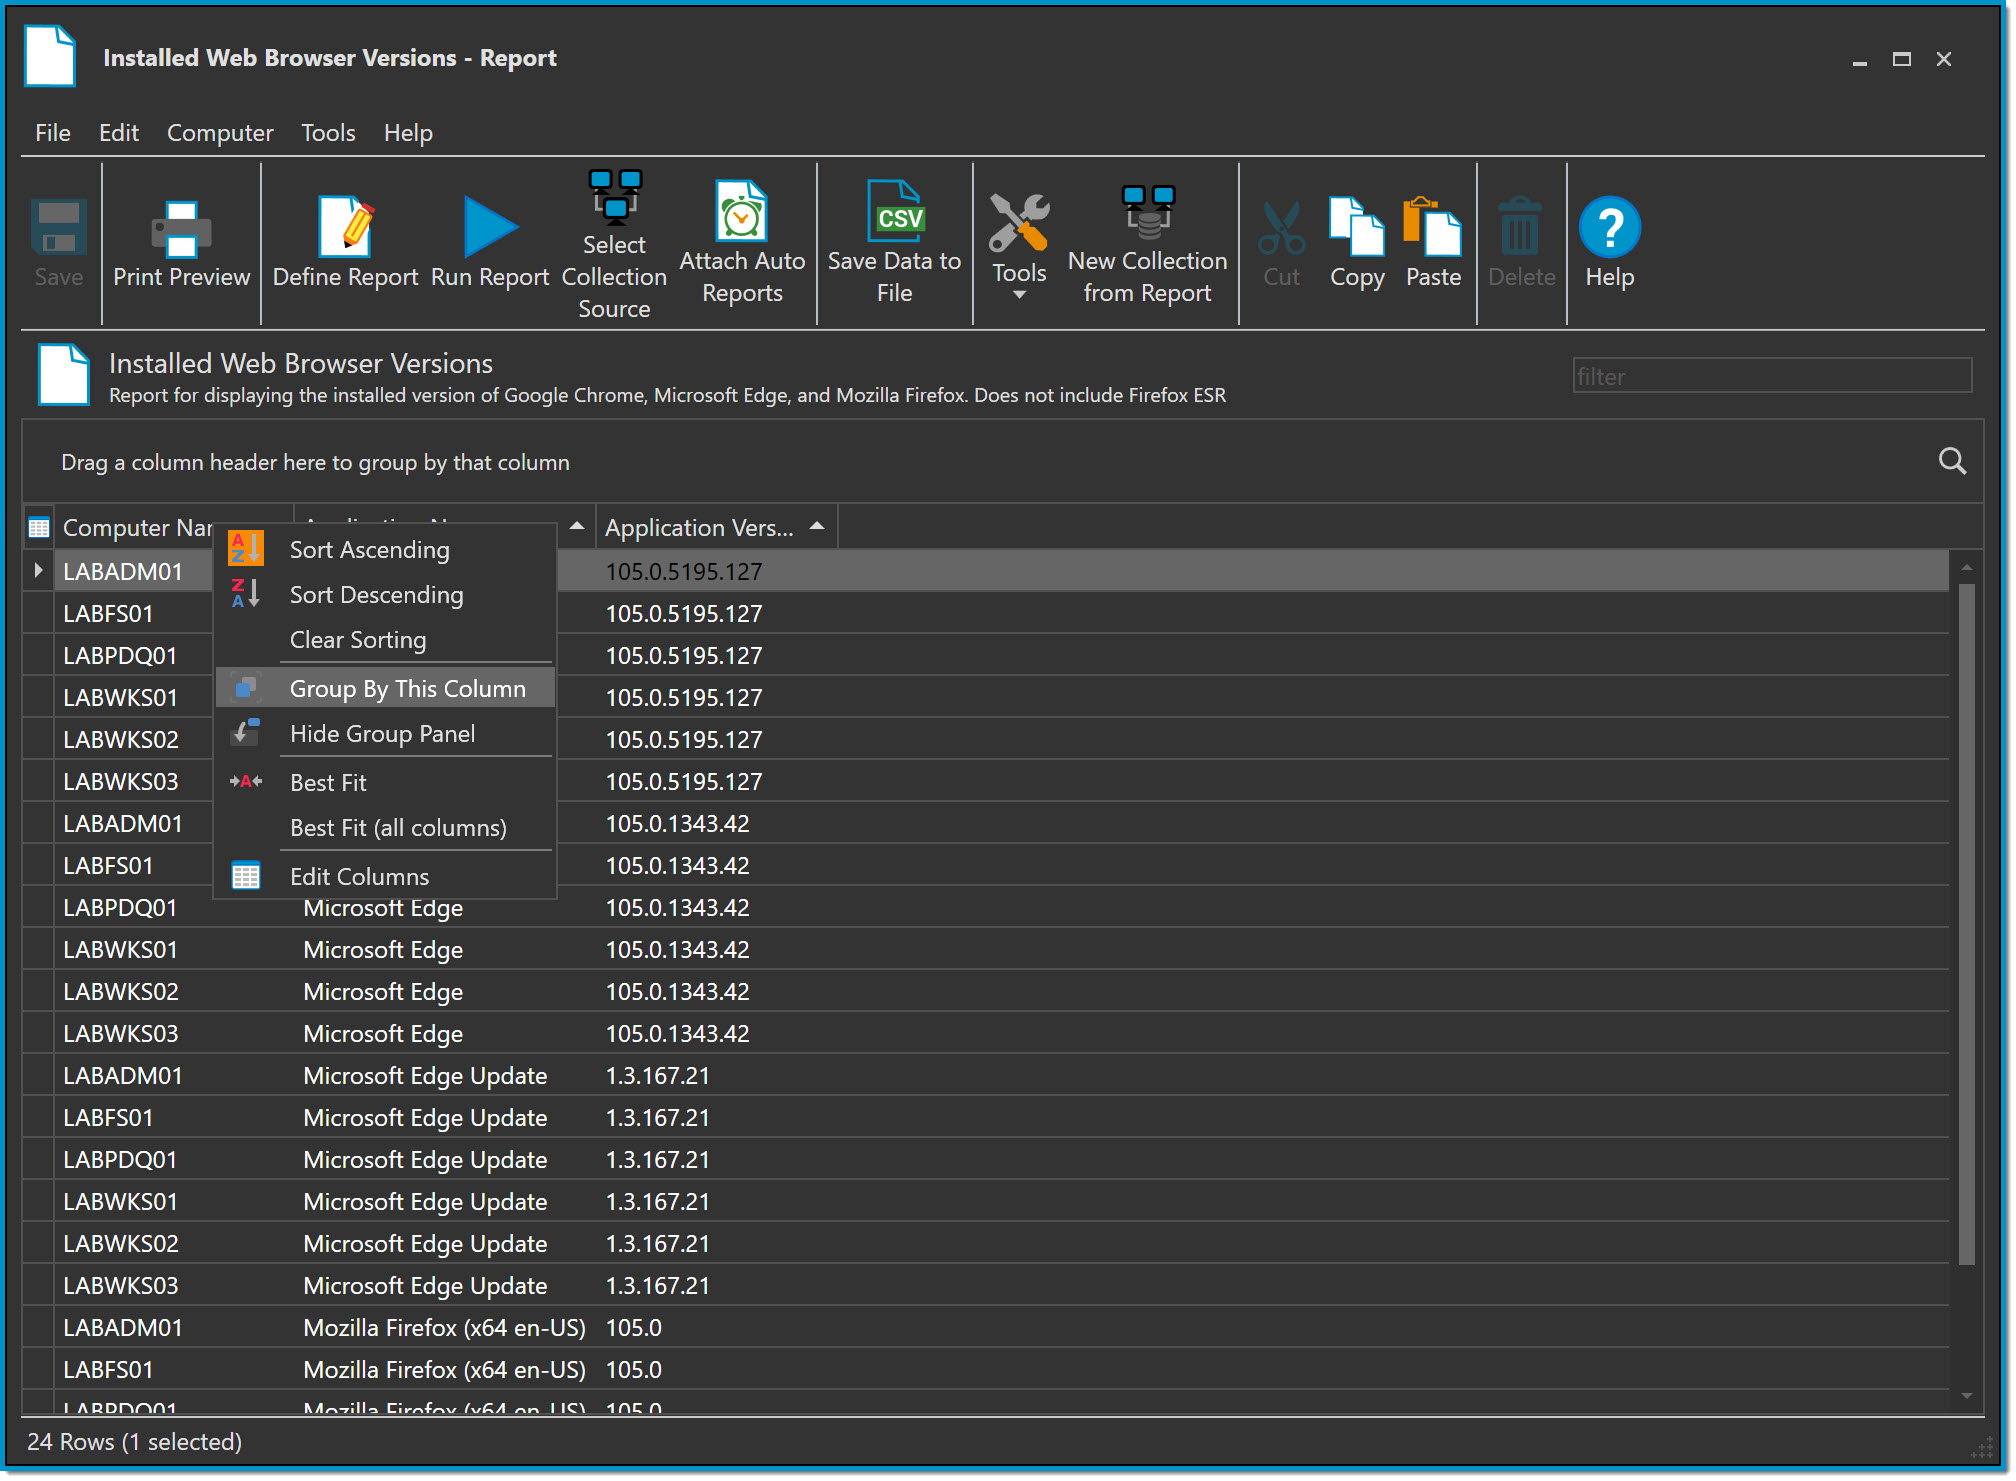
Grouping a Single Column
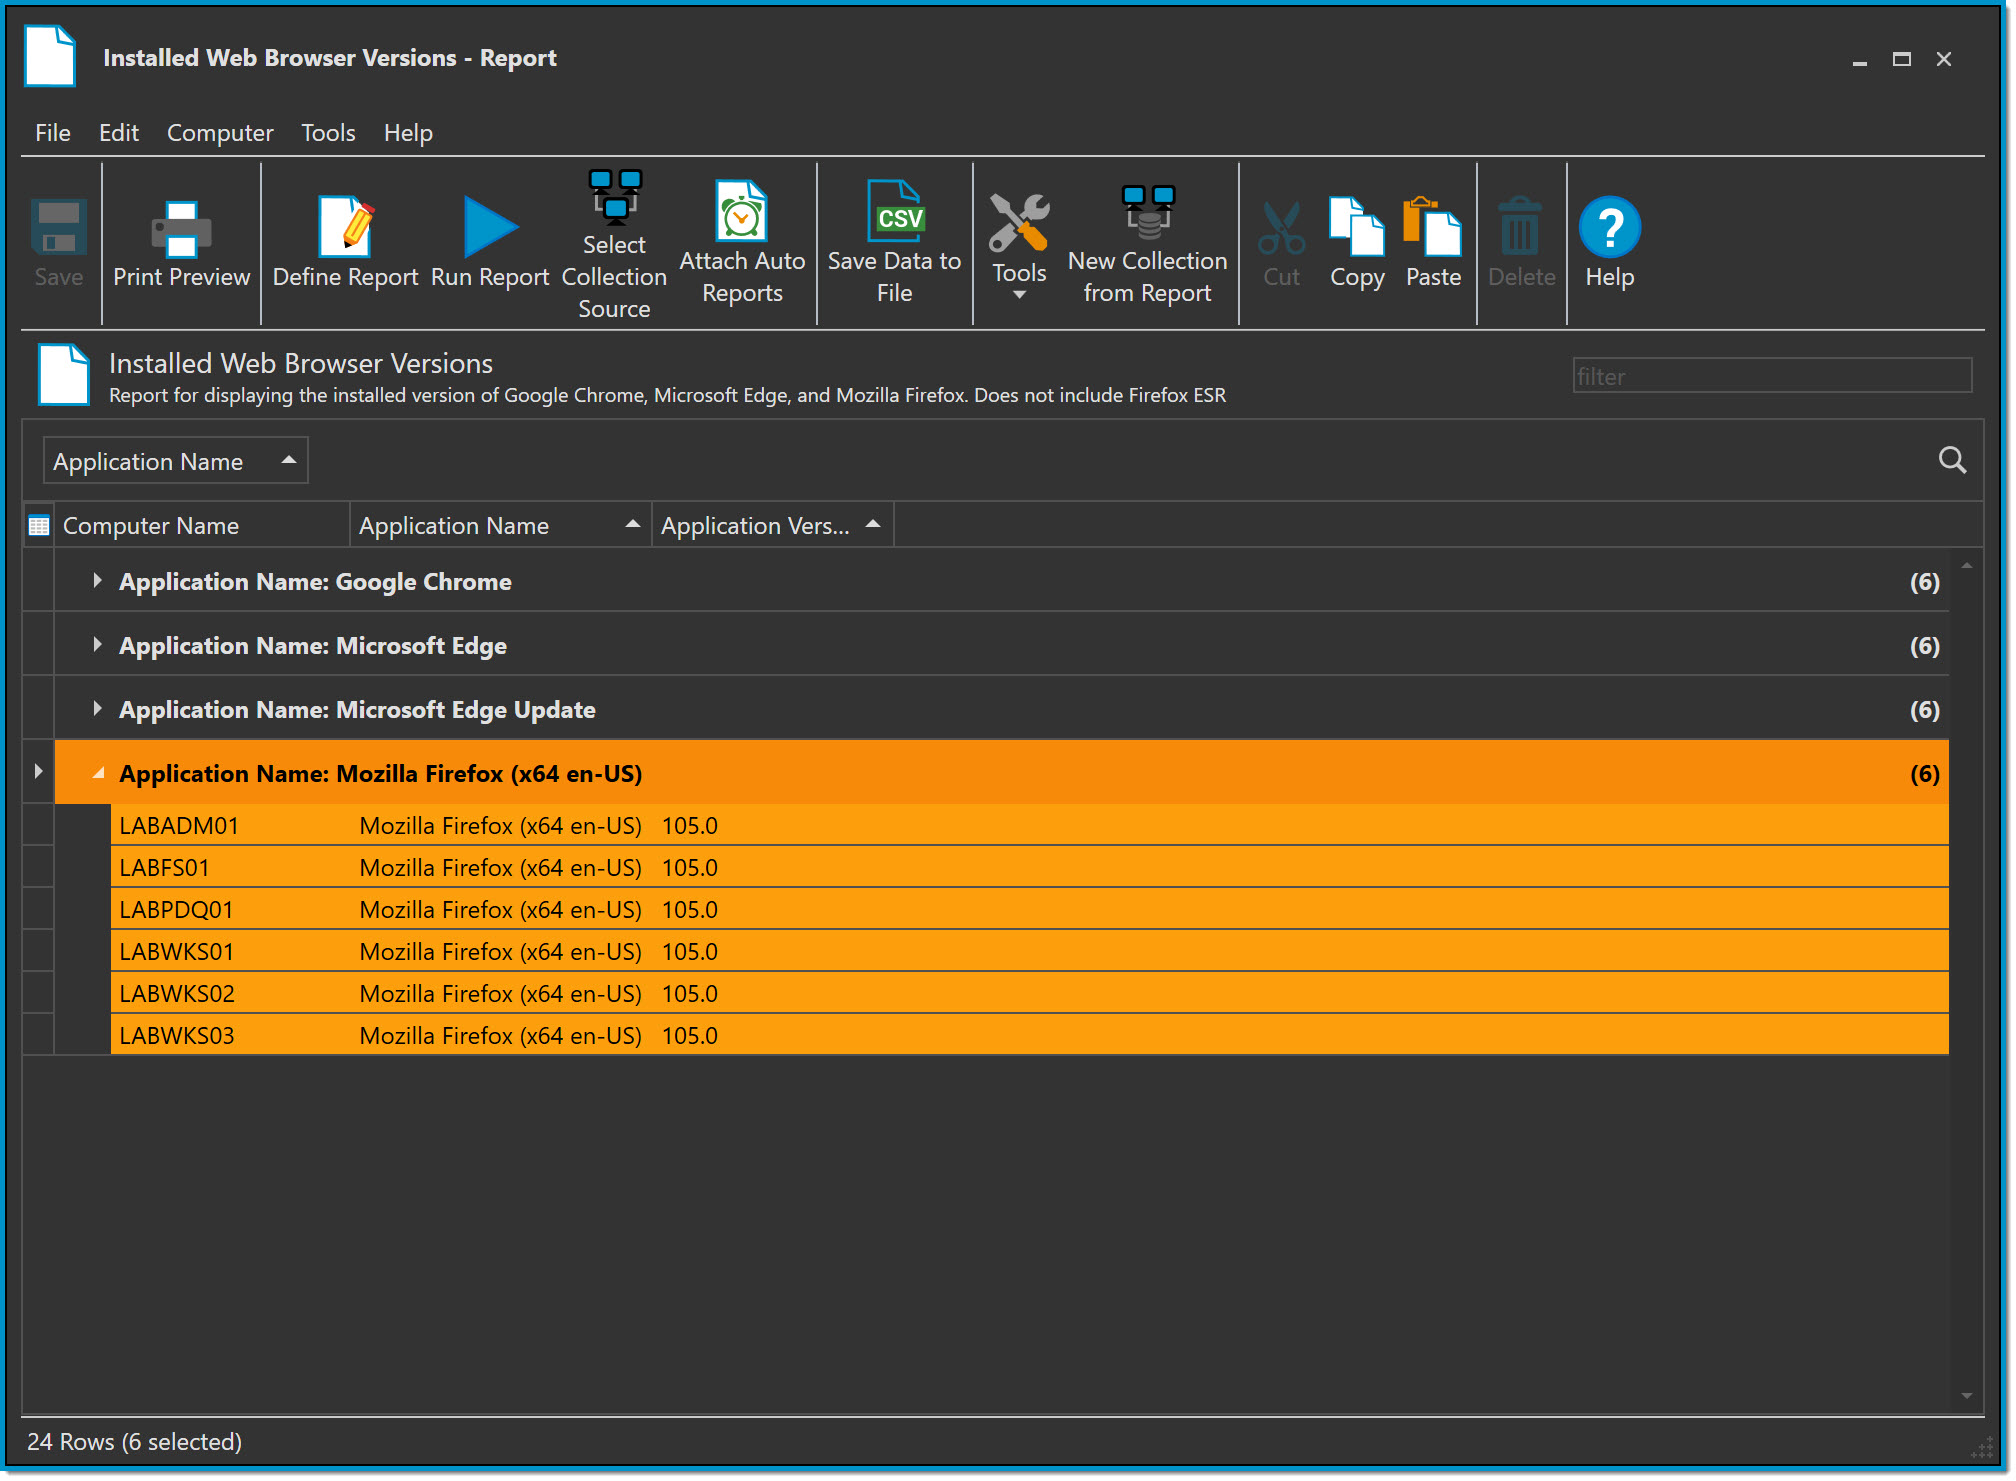
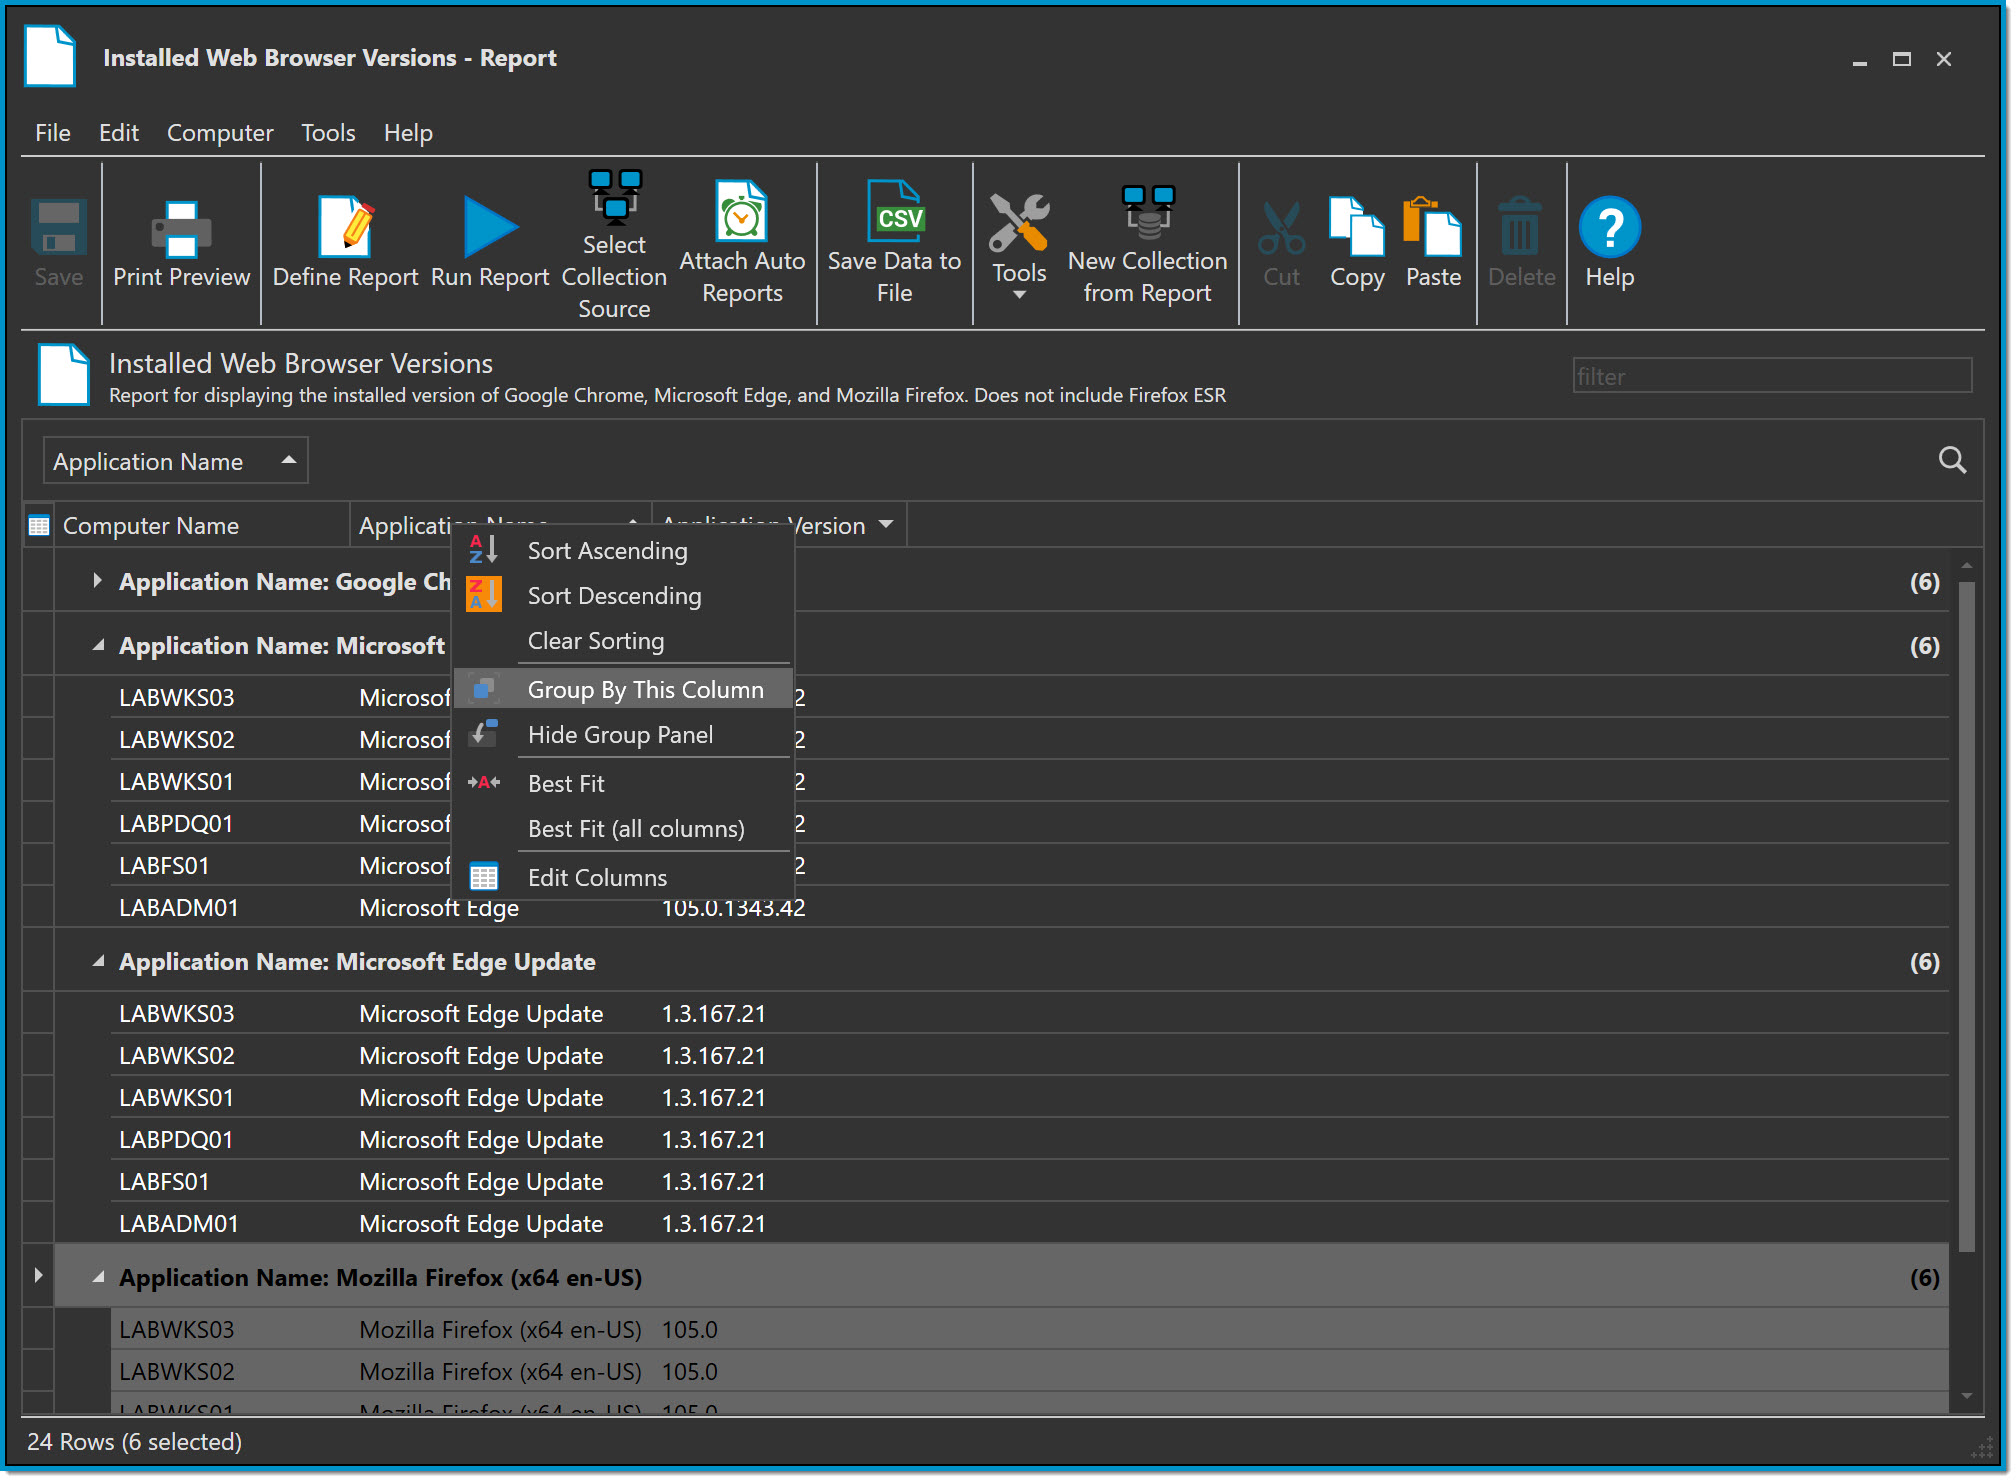
To group a single column, drag the column you wish to group into the Group Panel (or right click the column > Group By This Column).
Once you've grouped a column, select the drop-down arrow next to a group name to expand its results.
Grouping Multiple Columns
To group multiple columns, drag & drop the columns you want grouped in the order you want them to be grouped (or right click the columns you wish to group, in order, and select Group By This Column).
Once you've grouped a column, select the drop-down arrow next to a group name to expand its results.

The grouping hierarchy can be rearranged in the Group Panel by dragging and dropping a groups into the desired order.
To remove a group from the Group Panel:
- Right click the group and select Ungroup in the context menu.
- Drag and drop the group you wish to remove into the columns of the Report.
- If a red X is displayed when dragging a group away, the column for that group will also be removed.
- Right click into an empty space in the Group Panel and select Full Expand in the context menu to expand every group.
- Right click into an empty space in the Group Panel and select Full Collapse in the context menu to collapse every group.
- Right click into an empty space in the Group Panel and select Clear Group in the context menu to remove all groupings
Saving a Basic Report to a File
Selecting Save Data to File in the toolbar of an open Report will save the Report Results as a file. The file options are: .csv, .pdf, .xlsx, .xls, and .html.
If you are using grouped columns:
- The .pdf and .html file formats will display the contents of the Report exactly as they are displayed in the Report; any groups that were collapsed when the Report was saved as a file cannot be expanded.
- The .xls and .xlsx formats will contain all collapsed groups in hidden, expandable, rows.
- The .csv format will ignore all groupings and display only the columns and rows of the Report.