
High Memory Usage and Memory Leak
Bouma, Colby
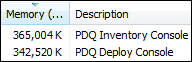
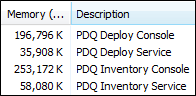
I am curious why the consoles use so much memory. Deploy starts around 190MB and Inventory around 250MB. After being open for a day or two they grow by over 100MB each. The attached screenshots show Deploy growing by about 140MB and Inventory by about 110MB. I have seen them closer to 500MB each, but didn't get a screenshot. 1GB of RAM for just the consoles seems like a lot to me.
What are the consoles doing that they eat so much memory? They are usually the most memory consuming processes on my computer. I have even started getting warnings about running out of memory.
Specs of workstation:
- Core i5
- 8GB RAM
- 128GB SSD for boot drive
- Windows 7 Enterprise 64-bit on a domain
2014-10-29_11-22-38.png
2014-10-29_12-54-49.png
0
Comments
I just ran a test. When I view computers in Inventory some of them cause the memory to increase by 4-12MB. By hitting Next a bunch of times I drove the memory usage up to about 670MB. Is Inventory caching the data for each viewed computer?
By viewing my packages one by one in Deploy I was able to get it up to about 607MB.
Hi Colby,
It does cache information about machines. I would guess that you have many machines that you manage
What size is your DB. File->Prefernece->Database
What is your Auto Clean up set to?
Lex
I want to add a wrinkle to this thread. The memory that PDQ products use is managed by the .NET Framework. You will notice a big chunk of memory allocated especially when there are a lot of deployments and scans. .NET is not aggressive about returning the memory to the OS if there is a lot of available memory on the system. If there isn't a lot of available memory then .NET is more aggressive with its Garbage Collection (the underlying .NET process which returns memory to the OS).
That being said, it is important to run the latest version of both products. There were some memory leaks discovered in PDQ Deploy 3.2 and these were fixed in Release 2 and Release 3.
Lex,
I have 663 computers right now. My DB is 118MB. My Auto Cleanup is set to 14 days.
Shane,
I am running .NET 4.5.1. I am running PDQD 3.2 r3 and PDQI 3.1 r4.
Thank you both for your feedback, I really appreciate it. Is there any way to turn off the caching or turn up the garbage collection on .NET? Would installing .NET 4.5.2 make any difference?
Hi Guys.
I'm running into the same thing with the newest version (4.2.0.0 Pro). High memory usage while idle. I was up over 500mb without a scan, update, deployment, etc going on. My DB is a whopping 900K. Any Ideas?
After making repeated changes to 1 report and other daily tasks in PDQ Inventory, it's currently consuming 1.6 GB. Normally PDQ Inv or Deploy in client mode run above 500m in Client mode on my machine.
Running version 14.3 in Client mode (so no background service) and .Net framework 4.6.00081.
@Andrew S
Thank you for reporting this issue. I have filed an internal bug ticket. I will let you know what we find out.
Thank you Colby. For me it appears PDQ Inventory starts to become sluggish and consume lots of RAM when repeatedly modified and running reports, adding numerous value filters etc.
We have around 250 PCs monitored by Inventory. Today I'm at 884,268k and modifying my reports, in the Define mode there may be a delay of up to 5 seconds from moving entries up or down or adding a new value filter.
Only seems to occur after I start to modify reports.
Is 15.1 working better for you?
I've got massive memory problems with Deploy (15.3):
The console consumes 400 MB right after start. Often it grows over 2.5 GB in an hour or so and gets unresponsible.
The service is at 2.5 GB also, running over a week.
We've got only 50 computer...
If i can help to analyze...?
@Stefan Strobel:
Do you have a large number of unused files in your Repository?
255 files... is this a large number?
No. Please contact support@pdq.com
Opened and closed a couple of reports I worked on previously and same issue in Inventory 15. Went to 850 MB, closed reports, minimized, reopened Define report now at 1.1 GB.
These reports in particular have a large number of value filters. Switching between the columns and filters tabs in Define Report memory usage continuously jumps up. After closing and minimizing PDQ eventually freed about 100 MB of memory (.NET garbage collection?).
I do have 8 GB memory on this PC but running a VM simultaneously. Less than 200 MB physical free now
Other user also experiences issue with slow behavior on Reports with large number of filters noted here: https://support.pdq.com/hc/en-us/community/posts/360000381951/comments/360000150011
My memory usage is pretty high as well, around 400-500 per console after 24 hours of being open. Just commenting in here to see if you guys have identified a fix. I'm in the process of migrating PDQ from my workstation to a server and am worried about memory leaks taking down this machine that also runs WSUS and SCCM.
I am also an issue with my server. Its extremely slow and i have various issues where the software crashes. I am running the most recent versions of both deploy and inventory.
@All:
If you have issues with high memory usage or crashing, please contact support@pdq.com.