Deployment Errors
Purpose:
Deployments are failing, and you need to investigate why.
Resolution:
This article covers how to view deployment status and where to find the errors & logs.
Contents:
Where to Find Deployment Errors
Deployment Status
Select All Deployments in the tree to view the All Deployments page, or select a package and navigate to the Deployments tab. The Deployments page displays all of your deployments that have not yet reached the cleanup threshold, as well as all of the targets from any selected deployments. Selecting a Deployment from the All Deployments page will display the target computers from that deployment, and the current status of the deployment for that target.
Deployments older than the cleanup threshold, configured in Options > Preferences > Deployments, will have been removed and will not appear in the All Deployments page.
Where to Find Deployment Errors
Deployments can be viewed from the All Deployments page, or by selecting a package in the tree and selecting the Deployments tab.
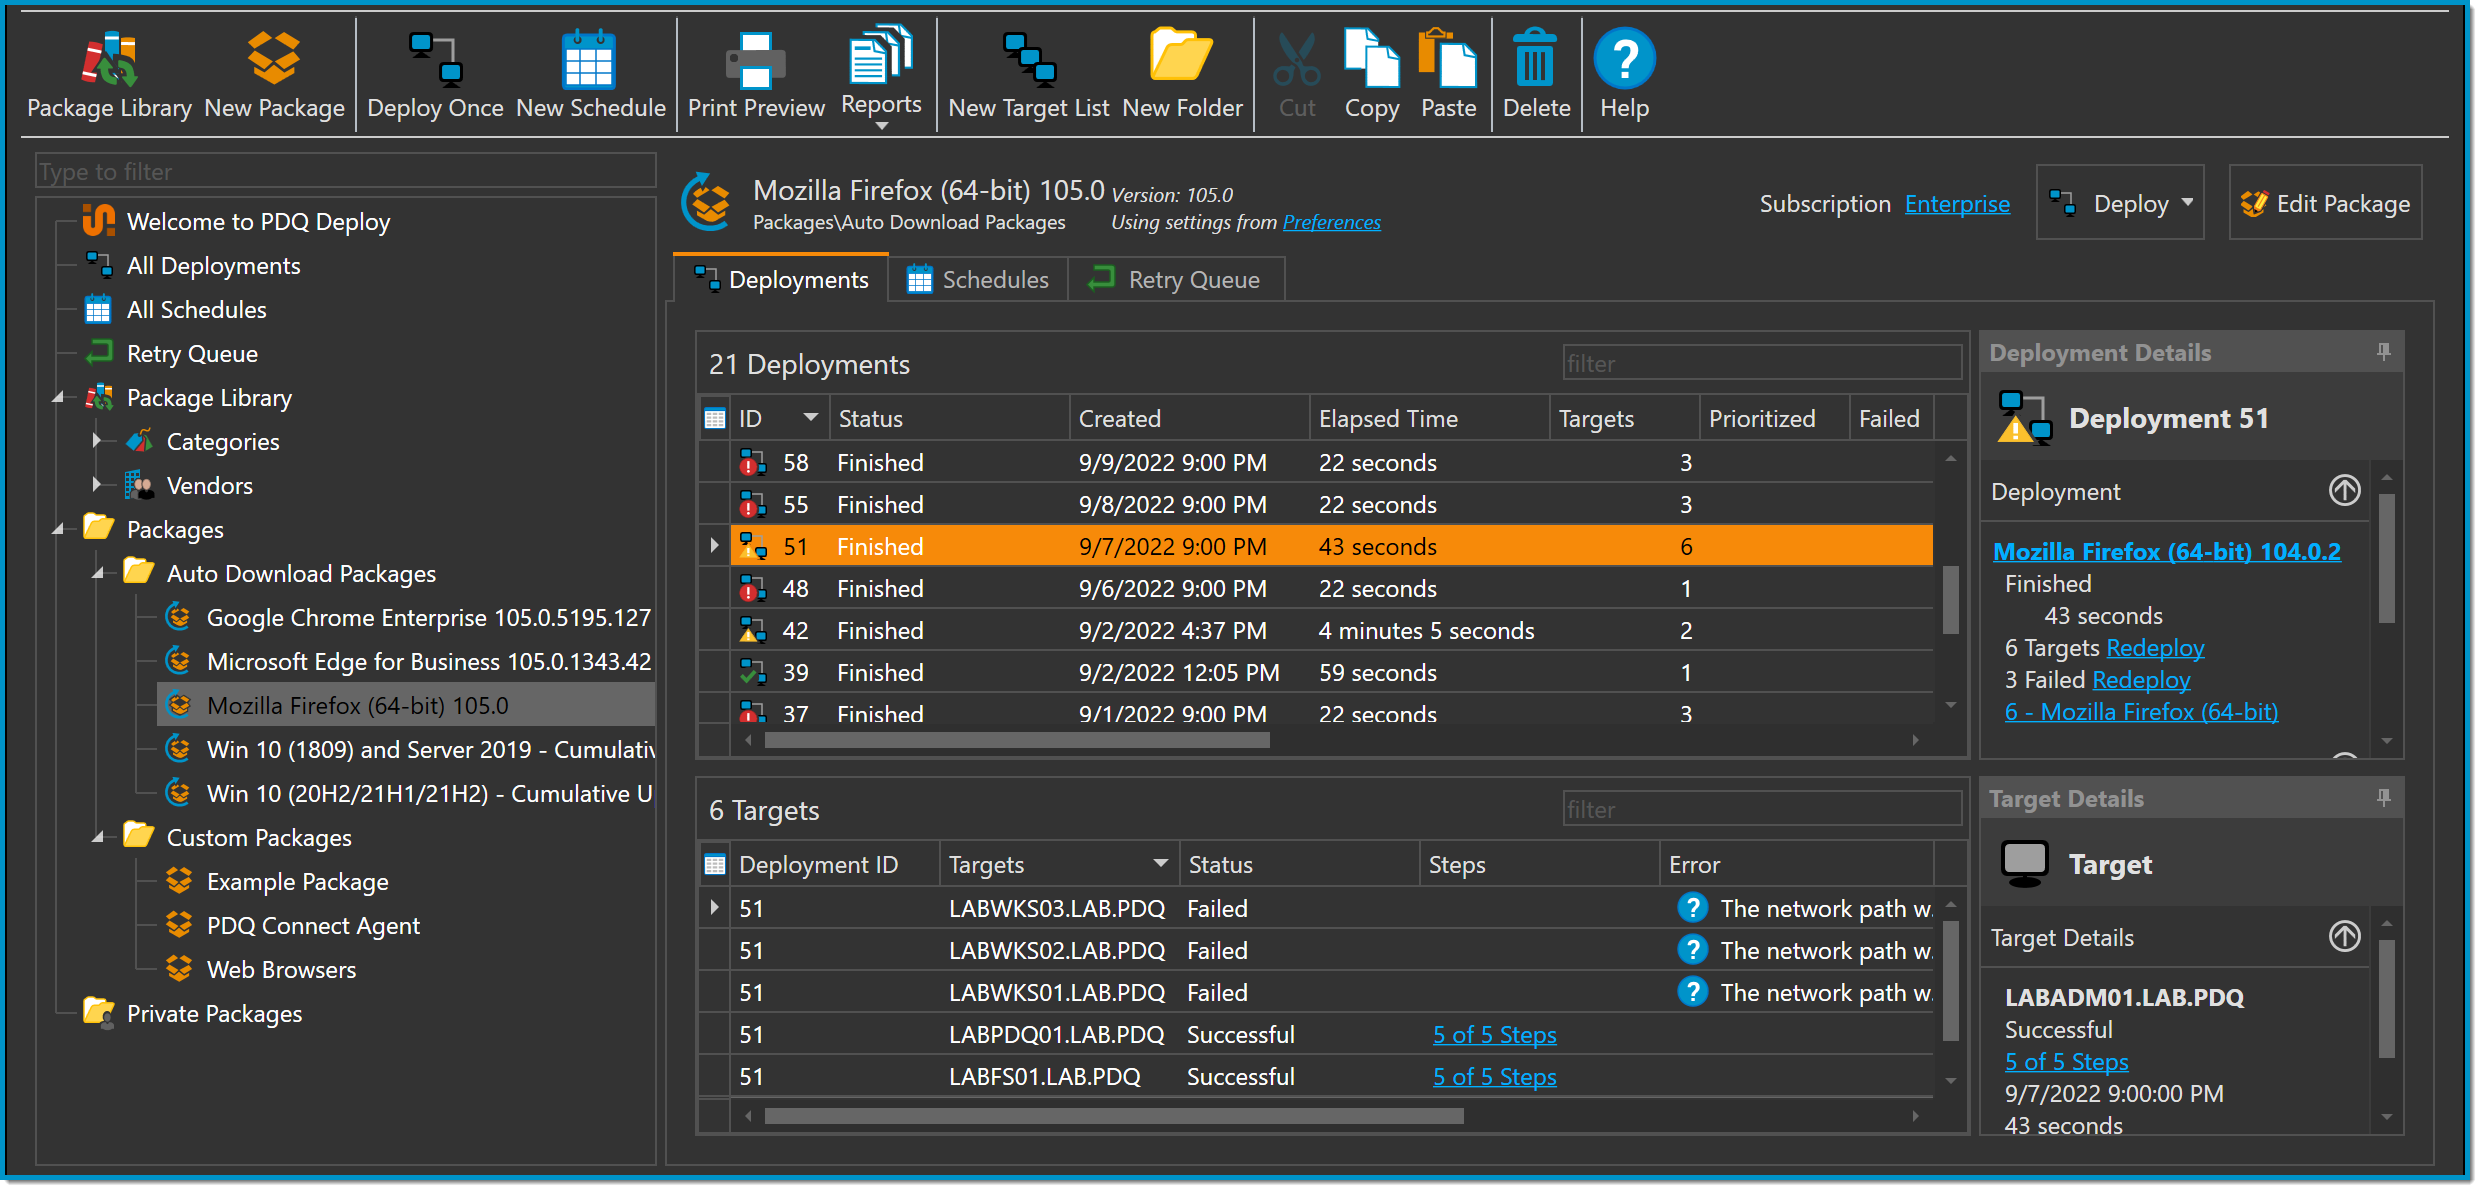
A deployment may be successful on some targets, but fail on other targets. A yellow icon in the ID Column indicates there were some successful targets and some failed targets. A red icon indicates all targets failed. The errors for the failed targets can be found by selecting the deployment and checking the Error column. Different targets may have different errors in a deployment.
Note: To view all of the targets from multiple deployments: use Ctrl+Click to select individual deployments to view together or Shift+Click to select a sequential group of deployments.
Output Logs
If the first step of a deployment was able to start, the Steps column and the Target Details menu will contain a link that can be selected to open the Steps page, where the Output Log can be found.
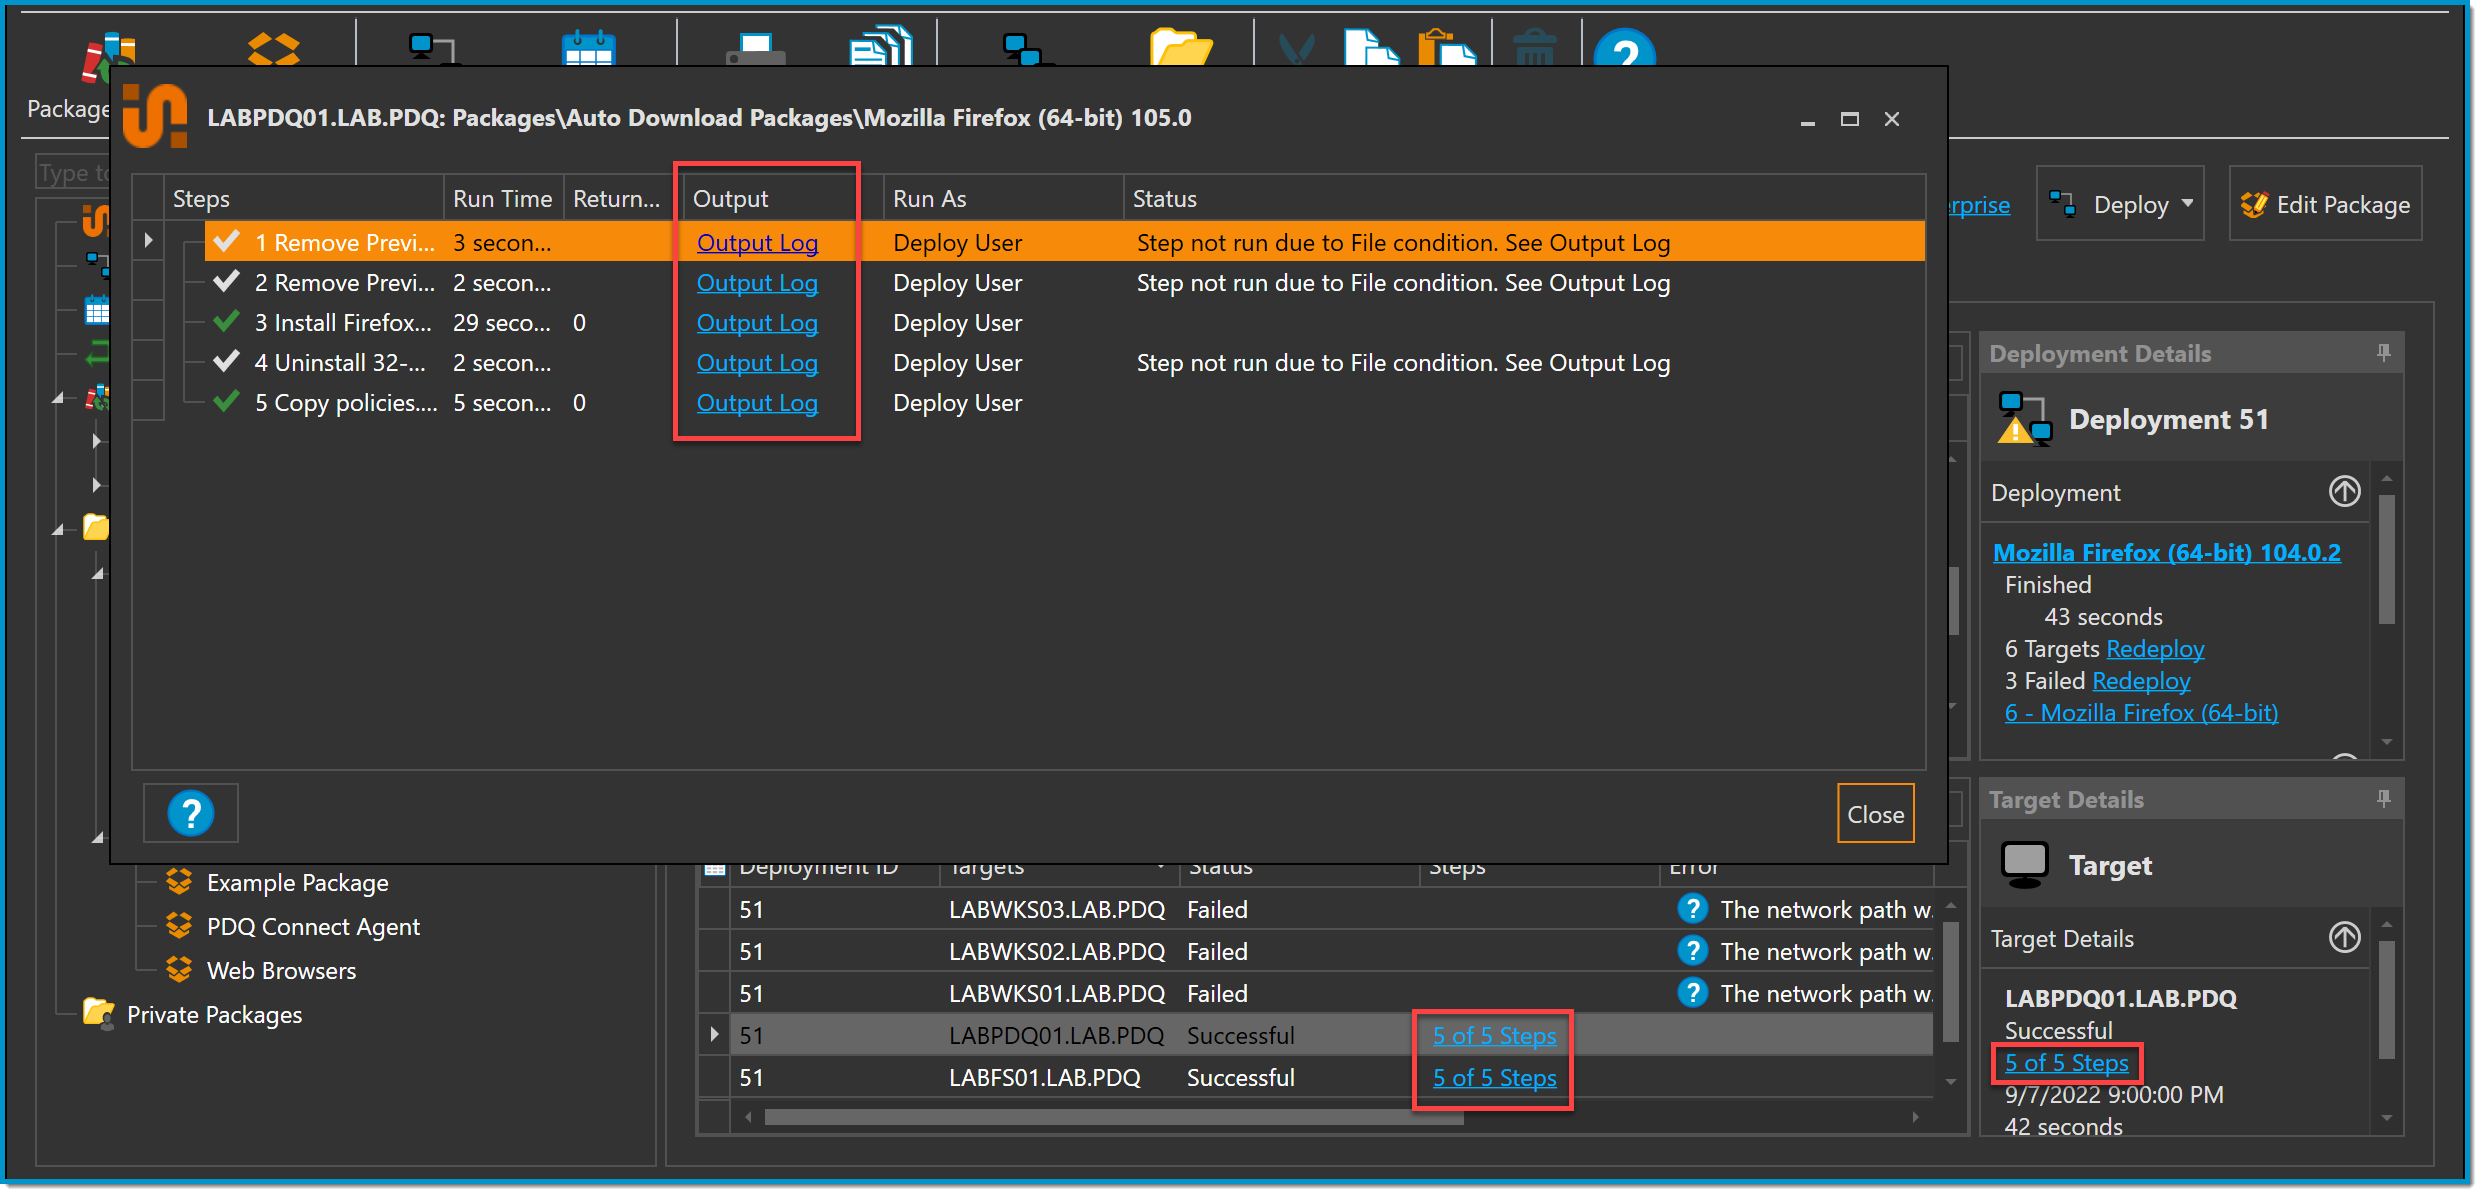
If the command for that step generated an output, regardless of whether it was successful or failed, there will be an Output Log link in the Output column.
Select the Output Log link to view a text file containing the command output for that step. Output Logs can be generated for successful and failed deployments. Not all Steps will generate an Output Log.
If the step failed, the Output Log may contain useful information for diagnosing what went wrong.
Stack Traces
Stack Traces contain diagnostic information about an error. They can be sent to PDQ Support, from within PDQ Deploy, as a support ticket.
Selecting the ? Icon in the Error column will display more information about the error.

Selecting Details will display details about the deployment.
Selecting More Actions will open a menu with up to three options:
- Output Log - Opens the Output Log for the failed step (will not be present if no Output Log was generated).
- Try Remote Repair - Runs the PDQ Remote Repair tool to analyze the connection to the target computer.
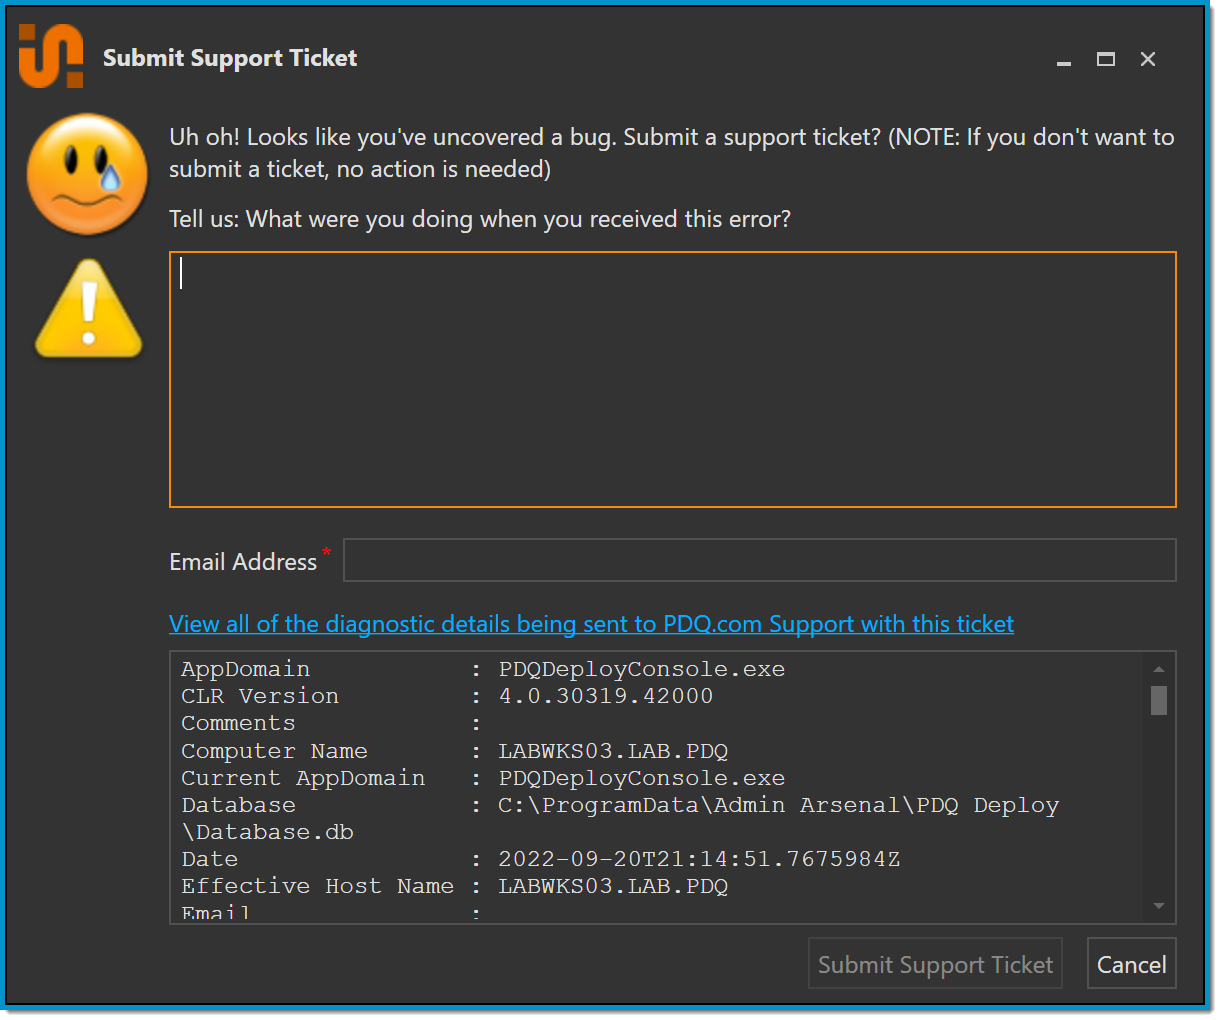
- Submit this issue to PDQ Support - Use this option to send the stack trace to the PDQ Solutions team as a support ticket. Support Tickets submitted in-product are treated the same as tickets submitted from the PDQ Help Center and tickets emailed to support@pdq.com.
- Tell Us - Enter any additional information you want to provide in the support ticket here.
- Email Address - Enter your email address, or the email you wish to open the ticket with, here.
- Diagnostic Details - This field contains the stack trace that will be provided to PDQ Support.
- Select View all of the diagnostic details to display everything that will be provided to the PDQ Solutions team in the Diagnostic Details field.